How to capture messages in Chrome browser
Capture Messages in Chrome Browser
Chrome provides Developer tools to learn, debug, verify various aspects of HTTP transactions done during link access. User can view all HTTP requests, responses, message bodies exchanged with server. Additionally user can see Websocket messages exchanged, network delay etc.
Here the scope of discussion is restricted to see all HTTP messages and Websocket messages exchanged between browser and server.
Introduction
In LM Tools it is necessary to know HTTP messages well advance before you can configure load test suites. You can capture HTTP messages either by using recorder that comes along with LM Tools or simply you can make use of Chrome's inbuilt Developer tools to capture the messages. Here, lets see step by step how to capture all messages send received between browser and server.
Steps
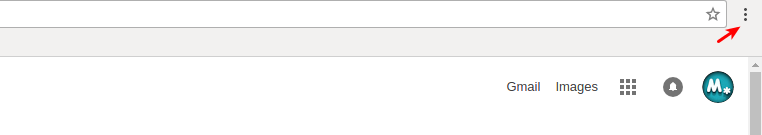
- Bring up Chrome browser. In right upper side corner of browser you can see more (vertically aligned dots) button as shown in below diagram.
- Click on more button, and then select More tools ---> Developer tools. You can see Developer tools window as shown below, select Network tab.
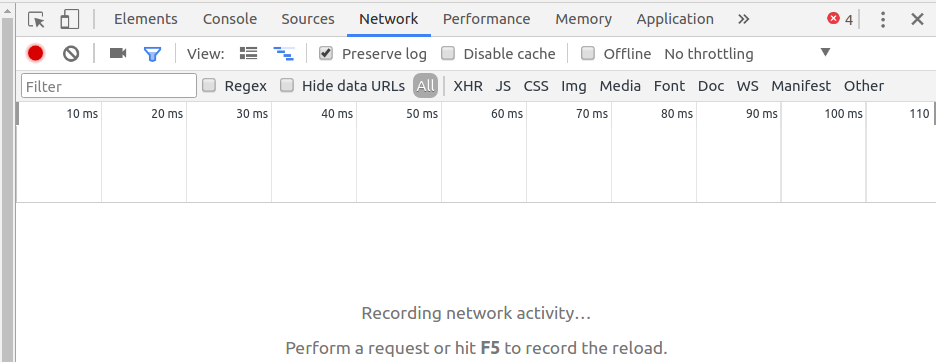
Please note that preserve log check box is selected. - Next you access any site, say lmtools.com.
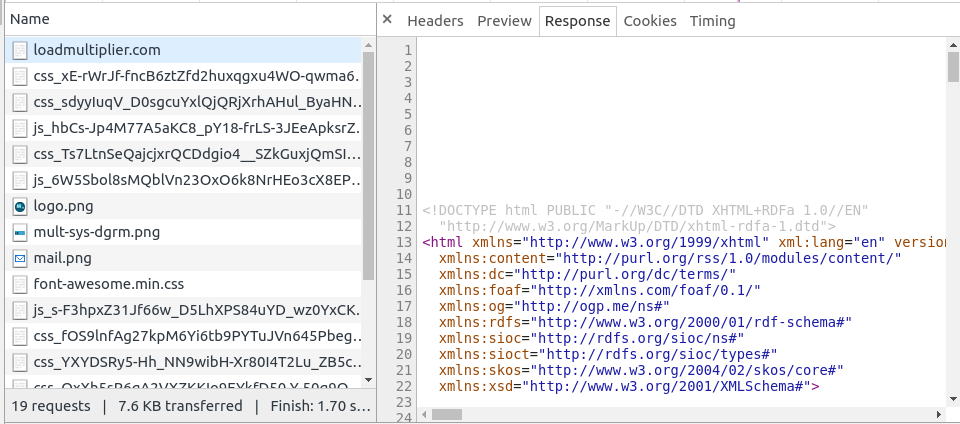
- You can see HTTP transactions in Developer tool's window. There will be some useful links such as lmtools.com and there will be some links really not required like links accessing an image or a javascript etc. Please refer below diagram. Select an useful link say lmtools.com. Now Developer tools window looks as below.
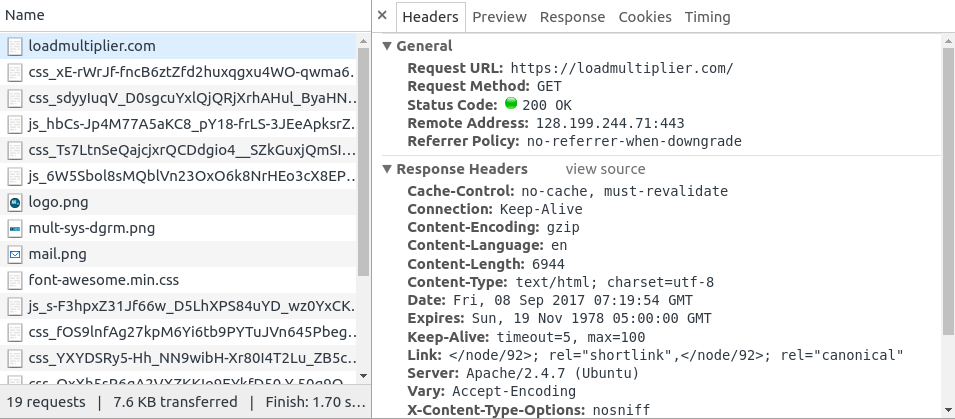
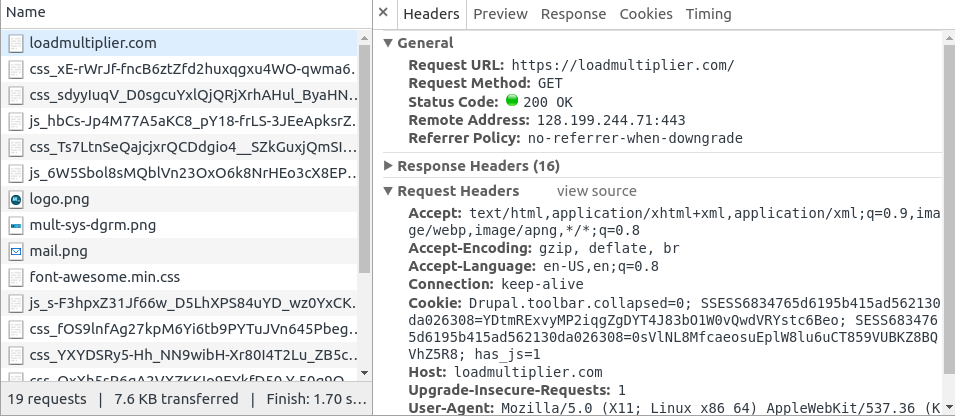
In right side of Developer tools window, you can see General section, Response Headers, Request Headers. From general section, you can collect link, method etc. From Response Header section, you can collect headers present in response message. - From Request Header section, you can collect headers present in request message. The Request Headers are shown as below.
- Select Response tab, you can see message body as shown below.
Conclusion
From steps above, you have link, method, request headers. So you can create a complete message as per below format.
Method Link HTTP/1.0
Headers
Blank Line
Headers
Blank Line
Also from above steps, you have status code, response headers, response body. You can prepare complete response message as per below format.
HTTP/1.0 Status Code
Headers
Blank Line
Body
Headers
Blank Line
Body
Hope it is helpful to capture all HTTP messages exchanged between server and Chrome browser.
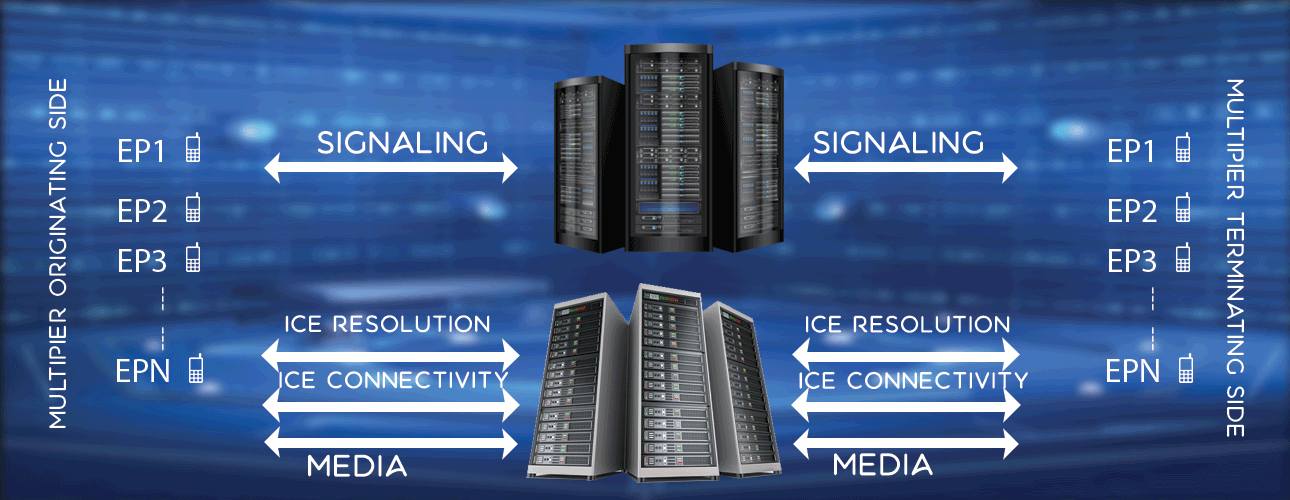
WebRTC Load Testing
Features
Signalling SIP, IMS, JSON, HTTP
Media PCMA, PCMU, AMR, OPUS, VP8
Security TLS, SRTP/DTLS, Websocket
Features , Syntax , Example
Performance, Capability
Machine Desktop 2.4 GHz, 8 GB RAM
Memory/Endpoint 12Kb
Rating 1 100,000 endpoints, 15 CPS, 15 sec call
Rating 2 3600 endpoints, 120 CPS, 15 sec call
Cost, Packages
Check cost, packages here.